January 30, 2025
We have spreadsheets for everything! We started keeping track of the well production when the well could only produce about 100 gallons a day and we had to watch it closely so we didn’t run out of water. Once we set the pump deeper (http://theviews.org/Life%20at%20the%20Views/2022/january-31-2022-setting-the-well-pump-deeper.html) that wasn’t so important, but we like to keep track of stuff anyway.
Today was a big day, we passed 200,000 gallons of water produced!
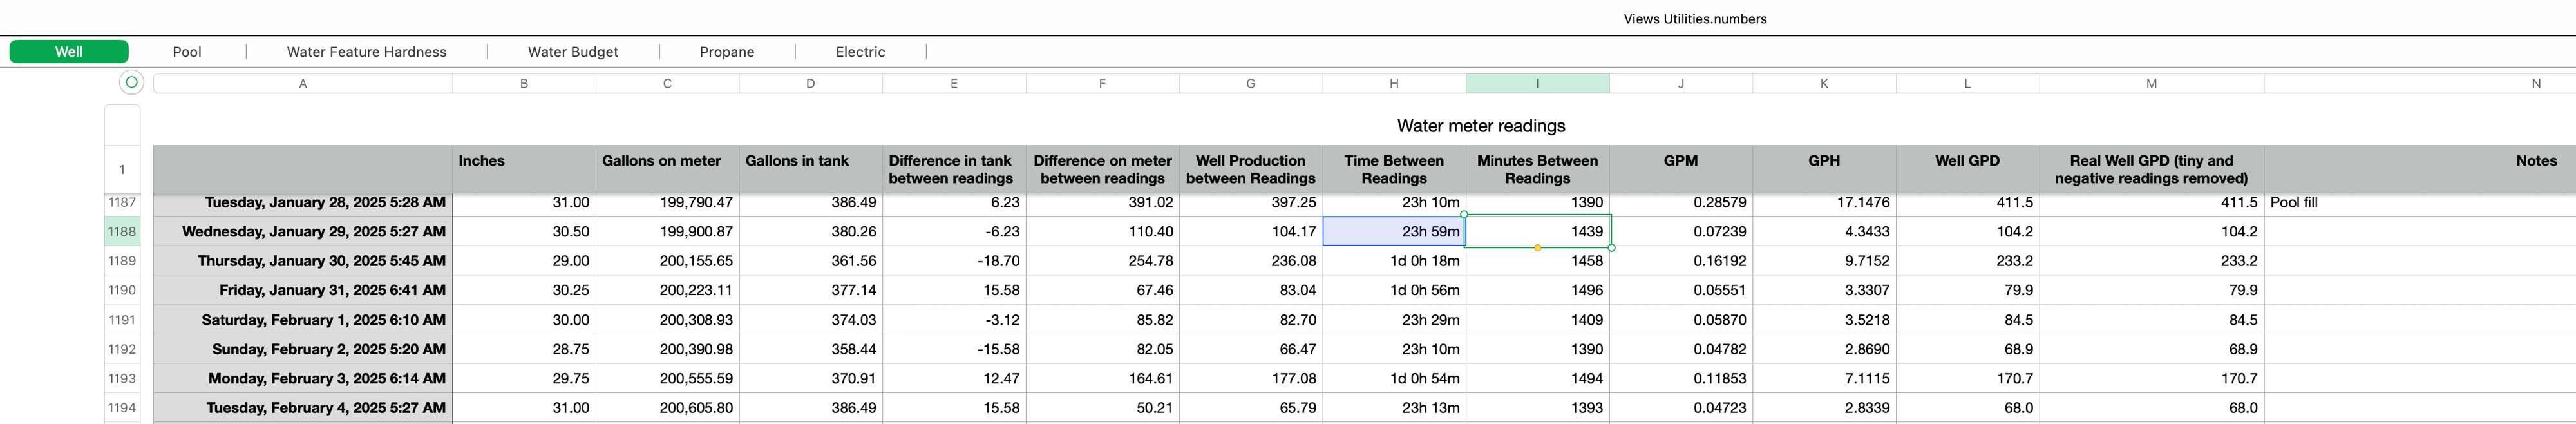
Well (pun intended), that’s one wide spreadsheet. We only have to manually fill in the timestamp, inches in the water tank and reading on the meter. All the other columns are calculated. Many of them aren’t really needed anymore, since we can produce more water than we need, but we just keep them.
The “Time Between Readings”, “Minutes Between Readings”, “GPM”, “GPH” and “Well GPD” are all used to normalize the calculation to a 24 hour interval so we can compare one day to another. Martin has found that while you can pile up a whole bunch of calculations in one formula, it’s just too hard to debug. A bunch of columns and simple formulas are a lot easier to deal with.